About
I'm a frontend engineer with 9+ years of experience building scalable web apps and interactive dashboards using React, D3.js, and modern JavaScript frameworks. I enjoy turning complex data into simple, meaningful user experiences, with a focus on performance, accessibility, and clean design.
Most recently, I worked at Zscaler as a Staff Software Development Engineer, where I modernized legacy systems by migrating them to React, built reusable component libraries, and delivered data-driven dashboards that visualized IoT and remote work trends during COVID.
In the past, I've had the opportunity to develop software across a variety of settings - from AI/ML focused organization to data analytics focused group.
When I'm not coding, you'll usually find me catching up on movies, smashing a few shuttlecocks on the badminton court, or just enjoying time with my wife and daughter.
Experience
2019 — 2025 Engineered and built impactful data visualizations, including a real-time IoT dashboard for predictive maintenance and a remote work dashboard that visualizes employee trends. I modernized legacy systems with React and D3.js, developed reusable components to improve development efficiency, and streamlined workflows by implementing CI/CD pipelines.
- React
- Redux
- JavaScript
- HTML & CSS
- D3.js
- Storybook
2018 — 2019 Built a real-time ML data visualization tool with AngularJS and D3.js, developed a plug-and-play TypeScript library to speed up integrations, and contributed new features and fixes to a client-facing app using JSP and jQuery.
- Angular
- JavaScript
- TypeScript
- HTML & CSS
- D3.js
- JSP
- jQuery
2016 — 2018 Delivered 10+ enterprise data visualization tools with D3.js, Highcharts, and .NET/C#, featuring interactive charts and exportable reports. Automated PowerPoint/PDF/Excel generation with Aspose, built a custom NuGet package manager to streamline workflows, and developed scalable REST APIs to boost backend performance.
- C#
- .NET
- JavaScript
- HTML & CSS
- Highcharts
- jQuery
- Aspose
Projects
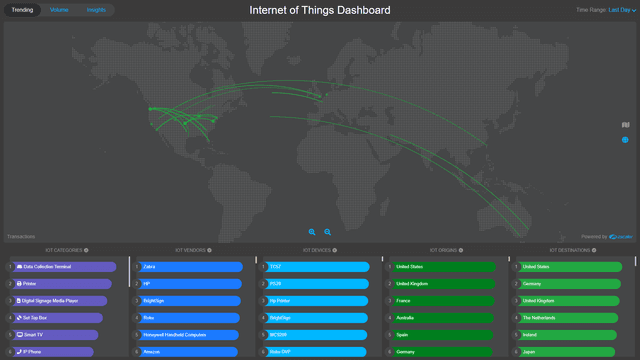
A dashboard to analyze millions of daily IoT device transactions. It provides insights into top devices, traffic patterns by time, manufacturer, and geography. Focused on enhancing visibility and securing communications from vulnerable IoT devices to reduce attack risks.
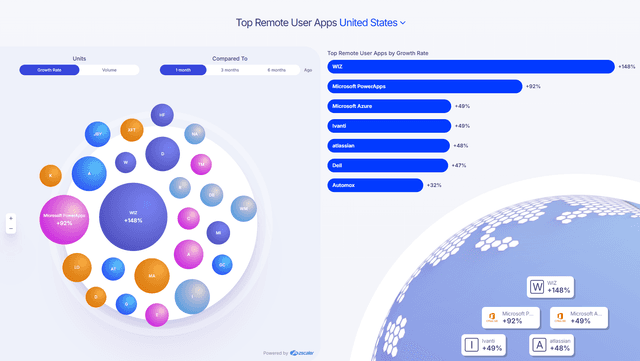
Interactive dashboard that visualizes global remote work trends since 2020. It highlights traffic patterns by country, shifts between remote and in-office users, and application usage growth over time.